Introduction
An engine bracket doesn't just vibrate from the road. It shakes from the engine, too.
Sine-on-random vibration testing captures both forces at once, layering discrete sine tones from rotating machinery on top of continuous random vibration from the road, airframe, or terrain.
The concept sounds simple. The execution isn't. Test outcomes swing widely based on shaker capacity, profile accuracy, and how well you calculate the combined GRMS before you ever hit "run."
This guide walks through what sine-on-random testing actually is, the step-by-step process for running one, how to calculate combined GRMS correctly, the parameters that make or break your results, and the mistakes that trip up even experienced test engineers.
Key Takeaways
- Sine-on-random overlays sine tones on random vibration to mimic engine harmonics plus road random loads
- Successful tests need shakers with sufficient combined force, displacement, and velocity headroom
- Combined GRMS equals the square root of summed squared random and sine RMS values
- Most failures stem from underestimated equipment demand or weak fixture design, not the test method
- An ISO/IEC 17025-accredited lab validates profiles and fixtures before you commit in-house resources
What Is a Sine-on-Random Vibration Test (and When to Use It)?
Sine-on-random vibration is the simultaneous application of continuous broadband random excitation with one or more discrete sine tones layered on top. The random component and the sine tones run at the same time, controlled independently but combined into a single composite profile.
Each piece represents something different happening in the field:
- Random vibration mimics broadband environmental input, road roughness, or aerodynamic buffeting
- Sine tones represent rotating machinery orders, such as engine firing frequencies, motor shaft speeds, propellers, or rotor blade pass frequencies
- The composite signal reproduces both effects at once, matching what the product actually experiences in service
You need this combined method only when a product genuinely experiences both excitation types at the same time in service. An engine-mounted sensor bracket is a textbook case: road random shakes the vehicle chassis while the engine's rotating assembly adds a distinct tonal signature underneath. Test it with sine alone or random alone, and you miss half the story.
MIL-STD-810H Method 514.8 recognizes sine-on-random as one of several mixed-vibration spectra and stresses tailoring the schedule to actual lifecycle data rather than borrowing numbers from an unrelated program.
Here's how the modes compare:
| Test Mode | Composition |
|---|---|
| Pure sine sweep | Deterministic tone only, no random background |
| Pure random | Broadband random only, no discrete tones |
| Sine-on-random | Random background plus one or more fixed or swept sine tones |
| Random-on-random | Random background plus a narrowband random signal, not a discrete tone |
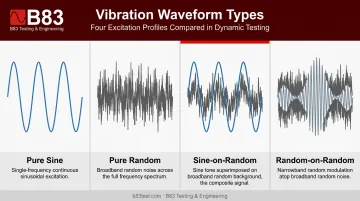
Choosing between them comes down to one question: does the field environment combine both excitation sources simultaneously, or does it only ever see one at a time?
How to Run a Sine-on-Random Vibration Test: Step-by-Step
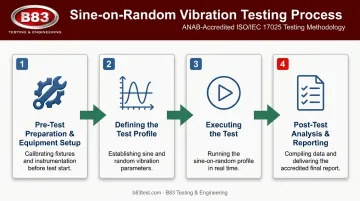
Running this test well means treating pre-test setup, profile definition, execution, and reporting as four distinct phases. Skip a step and you'll likely find out during the test, not before.
Step 1: Pre-Test Preparation & Equipment Setup
Before anything gets bolted to a shaker table, confirm the basics:
- Document the device under test's mass, center of gravity, and mounting orientation to match its real-world installation
- Verify the shaker system has enough combined force, displacement, and velocity capacity to produce both the sine tones and the random background at once, without exceeding rated limits
- Design or select a rigid, resonance-free fixture that transmits both components accurately to the test article
- Calibrate and mount control and response accelerometers at locations specified by the governing test standard
Shaker sizing matters more here than in a single-mode test, since sine and random demands stack rather than run separately. Independent labs typically maintain shaker fleets spanning a range of force ratings to match different DUT sizes.
B83 Testing & Engineering, for instance, runs five electro-dynamic shakers ranging from 4,000 to 18,000 lbf, along with in-house custom fixture design to keep resonances outside the test bandwidth.
Step 2: Defining the Test Profile
This is where most test-planning time goes, and rightly so. You need two separate but simultaneous inputs:
- Random breakpoint table — frequency versus amplitude in G²/Hz, representing the background environment
- Sine tone parameters — frequencies, peak amplitudes, and whether tones are fixed or swept to represent machinery orders
Source both from field data replication or the applicable test standard. Set the sine sweep rate and duration alongside the total random test duration, and make sure both run concurrently exactly as the specification requires. Running them sequentially instead of simultaneously defeats the purpose of the test entirely.
Step 3: Executing the Test
Never jump straight to full level. Run a low-level check-out first to confirm shaker response, fixture behavior, and control accuracy. This typically runs well below full amplitude, just enough to reveal problems before they become expensive ones.
From there:
- Ramp gradually to full test level while watching for unexpected resonances, excessive displacement, or waveform clipping
- Continuously monitor the control signal against the composite sine-plus-random reference profile
- Adjust equalization as needed to keep both components tracking within tolerance
Step 4: Post-Test Analysis & Reporting
Once the test completes, the analysis work begins. Review recorded time histories, PSD/ASD data, and sine tracking to confirm the achieved GRMS and sine peak levels landed within tolerance. Inspect the DUT for physical damage, loosened fasteners, or functional degradation, comparing pre- and post-test performance directly.
Document everything in a formal report referencing traceable, accredited reporting practices for a defensible pass/fail call. That accreditation matters because it ties every measurement back to a documented chain of calibration and competence, not just a printout.
Calculating GRMS for Sine-on-Random Vibration Tests
Standalone random tests calculate GRMS one way. Sine-on-random requires an extra step, since you're combining two fundamentally different signal types.
Random Background GRMS
Random GRMS comes from computing the area under each log-log segment of the breakpoint spectrum, then summing across all segments and taking the square root. For adjacent breakpoints, you calculate a slope (n) and coefficient (C) for each segment, then integrate. Vibration Research's breakpoint-area method walks through this segment-by-segment.
Converting Sine Tones to RMS
You specify each sine tone as a peak amplitude. Before it can combine with random data, convert it:
G(sine, RMS) = G(peak) ÷ √2
Combining Everything
Sine tones and random background don't add arithmetically. They add in mean square, meaning you square each value, sum the squares, then take the square root of the total:
G(total) = √[G(random)² + G(sine1)² + G(sine2)² + ...]
Worked Example
Say your random background computes to 2.5 GRMS. You have two sine tones: one at 1.0 g peak, another at 0.6 g peak.
| Component | Value | RMS |
|---|---|---|
| Random background | — | 2.50 GRMS |
| Sine tone 1 | 1.0 g peak | 0.71 GRMS |
| Sine tone 2 | 0.6 g peak | 0.42 GRMS |
Squaring and summing: 2.50² + 0.71² + 0.42² = 6.25 + 0.50 + 0.18 = 6.93
Total combined GRMS = √6.93 ≈ 2.63 GRMS
Notice the combined value is only slightly higher than the random alone, but that small jump drives real force demand through F = ma. Underestimate it, and you'll hit the shaker's rated force, displacement, or velocity limit sooner than expected. B83's shaker fleet spans 4,000 to 18,000 lbf, and even that range needs headroom for occasional peaks above the typical 3-sigma level.
Key Parameters That Affect Results When Running a Sine-on-Random Test
Outcomes depend heavily on how well you control and specify these four variables.
| Parameter | Why It Matters | Impact on Results |
|---|---|---|
| Random spectrum shape & GRMS | Defines broadband stress and fatigue contribution across the frequency range | Inaccurate breakpoints skew damage distribution, under- or over-testing the DUT |
| Sine tone frequency, amplitude & sweep rate | Represents discrete machinery orders adding resonant stress on the random floor | Wrong sweep rate changes dwell time at resonance, altering fatigue accumulation |
| Test duration & cycle repetition | Governs cumulative fatigue damage and resonance sweep count | Shortened duration undertests fatigue-sensitive parts; excessive duration risks unrepresentative failure |
| Shaker force, displacement & velocity | Combined loading creates higher cumulative demand than either component alone | Underrated equipment causes clipping, forced notching, or control faults that invalidate results |
Sweep rate deserves a closer look. ISO 16750-3:2012 specifies 0.5 octave per minute for its passenger-car engine and gearbox sine-on-random cases, with 22-hour durations per plane. That's automotive-specific; don't transfer it to aerospace or rail work without checking the governing spec for your application.
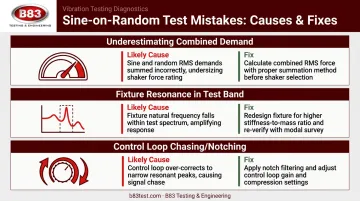
Common Mistakes & Troubleshooting Tips
Most sine-on-random problems fall into a handful of predictable categories.
Underestimating combined demand. Engineers sometimes evaluate sine and random force/displacement requirements separately instead of summing them. The shaker looks adequate on paper for each piece individually, then trips an overload alarm once both run together.
Fixture resonance inside the test band. A fixture with resonances in your test bandwidth causes false control readings and uneven load transfer to the DUT.
- Likely cause: Inadequate fixture design validation before testing
- Fix: Run a resonance survey on the bare fixture before mounting the DUT
Control loop chasing or unplanned notching. This usually shows up as the controller struggling to track the reference profile, sometimes triggered by the DUT or fixture itself.
- Likely cause: Accelerometer placement error or under-damped fixture response
- Fix: Verify control accelerometer location and apply standard-compliant notching rather than pushing past safe limits
Most sine-on-random failures come back to underestimated equipment capacity or a poorly defined profile, not a flaw in the test method itself.
If in-house shaker capacity or profile-calculation expertise is limited, an accredited independent lab experienced in combined sine-random testing can validate the profile and fixture design first. This avoids committing internal resources to a test that's set up to fail.
Frequently Asked Questions
What is sine on random vibration?
It's continuous random background vibration with one or more discrete sine tones superimposed, simulating combined real-world excitation sources like an engine running while a vehicle drives over rough road.
How do you calculate sine-on-random vibration?
Square the random background GRMS and each sine tone's RMS value, sum all the squares, then take the square root of the total. Tones and random never add arithmetically.
How do you calculate g RMS for random vibration?
Compute the area under each log-log segment of the ASD breakpoint curve, sum the segment areas, then take the square root of the total mean-square value.
What's the difference between sine-on-random and random-on-random testing?
Sine-on-random adds discrete tones to a random floor. Random-on-random instead modulates one random spectrum's amplitude with another random signal. Each suits a different real-world excitation pattern.
What industries commonly require sine-on-random testing?
Aerospace, automotive, rail, and industrial equipment sectors where rotating machinery, such as engines, motors, or turbines, operates inside a broader random vibration environment.
How long does a typical sine-on-random vibration test take?
Duration depends on the governing specification and fatigue requirements. Some run a single sweep cycle lasting minutes; others extend to multi-hour endurance profiles, like ISO 16750-3's 22-hour automotive cases.