That's exactly what random vibration testing is built to simulate. Before a design ever reaches the field, engineers need proof it can survive the unpredictable stress of daily use — not just a single tone swept across a frequency range.
Random vibration failures aren't rare. NASA's own reliability research has traced electronic packaging failures, including gold bond wire fractures, directly to resonant flexure under broadband vibration exposure during testing (NASA gold wire fatigue study). This guide breaks down what random vibration testing is, how it works, and why it matters for product durability.
Key Takeaways
- Random vibration testing applies broadband, multi-frequency energy defined by a PSD curve, not a single tone
- Unlike sine testing, random testing excites multiple resonances simultaneously, closely mirroring real-world conditions
- Grms measures overall vibration severity as the square root of the area under the PSD curve
- Standards like MIL-STD-810, DO-160, and IEC 60068-2-64 set test parameters by industry and application
- Accredited labs like B83 Testing & Engineering deliver documented, third-party validated vibration data engineers trust
What Is Random Vibration Testing?
Random vibration testing subjects a device under test (DUT) to a broadband, non-deterministic vibration profile. Instead of one clean frequency, the shaker table excites a wide frequency range simultaneously, characterized by a Power Spectral Density (PSD) curve rather than a repeating waveform.
Here's the key distinction: you can't predict the exact motion at any instant. Random vibration is stochastic, described statistically rather than as an exact signal.
Per MIL-STD-810H Method 514.8, this content is assumed to follow a Gaussian probability distribution unless field-measured data shows otherwise. Test controllers typically limit drive clipping to no less than 3 standard deviations (MIL-STD-810H Method 514.8).
Random vs. Sine Vibration Testing
Sine testing sweeps through one frequency at a time, hunting for resonances. Random testing does something different: it excites every frequency in the test range at once, at randomized amplitudes and phases.
This matters because real-world environments rarely vibrate at just one frequency. NASA's small satellite vibration guidance confirms that random testing excites all structural modes within the test spectrum simultaneously (NASA vibration testing guide). That simultaneous multi-mode response is something a sine sweep simply can't reproduce.
Understanding PSD, ASD, and Grms
PSD and ASD refer to the same metric: mean-squared acceleration per unit frequency bandwidth, expressed in g²/Hz. The shape of this curve tells you how vibration energy is distributed across the frequency spectrum.
Grms (root-mean-square acceleration) is the single number that represents overall severity:
- Calculated as the square root of the area under the PSD curve
- Higher Grms values mean more aggressive testing
- Test tolerances typically specify Grms accuracy within ±10% of target
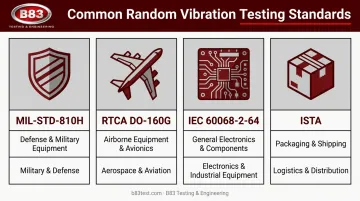
Common Standards Used in Random Vibration Testing
Different industries invoke different standards:
- MIL-STD-810H – Defense and military hardware, tailored to life-cycle environments
- RTCA/DO-160G – Airborne equipment certification, referenced in FAA advisory circulars
- IEC 60068-2-64 – General-purpose broadband random testing across electronics and land/air vehicles
- ISTA procedures – Packaged-product distribution simulation, common in shipping and logistics
Selecting the right standard depends on the product, the customer contract, and the real-world environment being replicated, not just industry convention.
Why Random Vibration Testing Is Critical for Product Reliability
Vibration is everywhere in transport and industrial equipment: uneven roads, rail track irregularities, engine harmonics, flight turbulence. Simulating that same randomness in a lab is the only reliable way to validate whether a product will hold up once it leaves the factory floor.
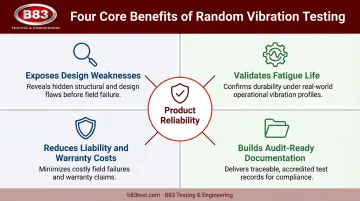
Core benefits of random vibration testing:
- Exposes design weaknesses before they become field failures
- Validates fatigue life under simultaneous multi-frequency resonance, something sine testing can't replicate
- Supports regulatory and customer compliance requirements
- Builds documented proof of quality for audits and design reviews
These benefits aren't theoretical. NASA's investigation into a solid-state recorder failure during box-level testing, at 6 Grms with content extending to 850 Hz, found that long gold bond wires suffered fatigue fracture from resonant flexure (NASA gold wire fatigue study). That's a documented example of vibration fatigue caught through testing, not in the field.
Catching that kind of failure mode in a lab, rather than after a customer complaint, changes the entire cost equation. It's tied directly to:
- Reduced liability and warranty costs from catching defects before shipment
- Improved customer satisfaction through verified product durability
- Lower insurance and risk exposure backed by accredited, documented test data
Every industry B83 serves (automotive, rail, agricultural and construction equipment, medical devices, aerospace) deals with a different vibration signature. Road-induced vibration doesn't look like rail track excitation, and neither resembles flight turbulence. That's why generic PSD profiles only go so far; tailored test specs matched to the actual operating environment matter.
How Random Vibration Testing Works – Step by Step
This is the practical sequence engineers follow when commissioning a real test. A few common oversights derail programs before they even start:
- Using generic published PSD profiles without validating against actual field data
- Skipping pre-test fixture resonance checks
- Failing to close the loop with design changes after a failure
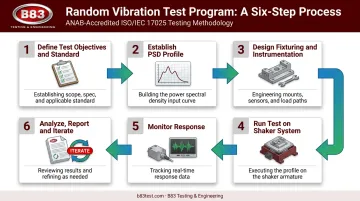
Step 1 – Define Test Objectives and Applicable Standard
Identify the governing spec first, whether it's a customer requirement, MIL-STD-810, ISTA, or another standard, along with the real-world environment being simulated. This decision drives everything downstream, including test accuracy and compliance alignment.
Step 2 – Establish the PSD Profile and Test Parameters
Build the profile using field-measured data when available, or standard-published PSD curves when it's not. Field data replication produces stronger real-world correlation than generic published profiles alone.
Step 3 – Design Fixturing and Instrumentation
Custom fixtures and correctly placed accelerometers are non-negotiable. A poorly designed fixture can introduce its own resonance, masking the device under test's (DUT) true response and skewing results.
Step 4 – Run the Random Vibration Test on the Shaker System
The shaker runs closed-loop control, continuously matching the target PSD across the defined frequency range. Multi-axis testing typically requires separate runs per direction to fully characterize the DUT's response. B83 Testing & Engineering, for example, runs this stage across a fleet of five electro-dynamic shakers rated from 4,000 to 18,000 lbf, matching force capacity to the DUT's size and mass.
Step 5 – Monitor Response and Interpret Results
During and after the run, engineers track RMS acceleration, watch for resonance shifts, and apply pass/fail criteria to catch both intermittent and catastrophic failures.
Step 6 – Analyze, Report, and Iterate
Results get documented against the governing test standard. Findings then feed back into design changes, followed by re-testing to confirm the fix actually worked.
Real-World Example: Random Vibration Testing Walkthrough
Picture an electronic control module destined for off-highway equipment, such as a tractor or compact loader. Here's how a typical test program at B83 might unfold:
- Define the transport PSD spec based on the equipment's expected duty cycle and vibration environment
- Mount the unit on a custom fixture designed specifically for the module's mounting geometry
- Run the test at increasing severity levels, tracking response the whole way through
- Detect an intermittent connection failure at a specific frequency band, visible as a signal dropout during the run
Common mistakes at each stage include skipping a sine-sweep resonance check before and after the random run, or overlooking multi-axis requirements because the vertical axis "looked fine."
In this scenario, the intermittent failure traces back to a connector losing contact under resonant flexure — not a catastrophic break, but enough to cause a field complaint down the road.
The fix: a reinforced bracket and added strain relief at the connector interface. A re-test at the same PSD profile confirms the connection holds steady through the full duration, with no signal dropout.
How B83 Testing & Engineering Can Help
B83 Testing & Engineering is an engineer-owned, independent testing laboratory in Milwaukee, Wisconsin, accredited by ANAB to ISO/IEC 17025:2017. That accreditation explicitly covers Vibration Testing (Sine & Random), meaning PSD-based random vibration work falls squarely within our documented, audited scope.
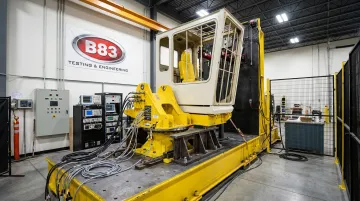
We operate five electro-dynamic shakers ranging from 4,000 to 18,000 lbf, capable of running random, sine, and mixed-mode vibration tests to any standard or custom PSD profile. That range covers everything from delicate electronic assemblies to larger structural components.
What sets our approach apart:
- Custom fixture design and engineering support built around your specific DUT geometry
- Field Data Replication (RPC®) to improve real-world correlation instead of relying on generic profiles alone
- Flexible scheduling for tight product-launch timelines
- 20+ years of client partnerships across automotive, rail, agricultural and construction equipment, medical devices, and aerospace
Accredited, third-party test data strengthens your design validation, reduces liability exposure, and gives your team documentation that holds up under customer or regulatory audit. If you're planning a random vibration program, reach out to our engineering team to discuss your specific PSD requirements.
Frequently Asked Questions
What is a random vibration?
Random vibration is non-periodic, non-deterministic motion characterized statistically through a PSD curve rather than an exact repeating waveform. This behavior is common in road, flight, and machinery environments.
Why am I feeling random vibrations?
Everyday random vibration comes from irregular surfaces, engine or motor operation, and structural responses to turbulence. That same real-world randomness is what testing labs replicate on a shaker to validate product durability.
What is the ASD of random vibration?
ASD (Acceleration Spectral Density) refers to PSD measured in acceleration units and expressed in g²/Hz. It shows how vibration energy is distributed across the frequency spectrum.
What's the difference between random and sine vibration testing?
Sine testing excites one frequency at a time to find resonances. Random testing excites all frequencies simultaneously, giving a far more realistic simulation of field conditions.
What standards govern random vibration testing?
Common specs include MIL-STD-810, RTCA DO-160, and IEC 60068-2-64. The right standard depends on your industry, application, and customer or contractual requirements.
How long does a random vibration test typically take?
Duration depends on the governing standard, required severity and duration levels, and whether multi-axis testing is needed. Programs can range from a few hours to several days.