That's where shock pulse testing comes in — and the half-sine waveform is one of the most common shapes engineers use to answer it. Misjudge the wrong pulse shape for your application, and you risk a product that passes testing but fails in the field, or a compliance report that doesn't hold up to scrutiny.
This article breaks down what a half-sine shock pulse actually is, how it compares to other classical waveforms, where it's applied across industries, and how engineers measure and analyze it using tools like the Shock Response Spectrum. We'll also touch on the standards that govern this testing and how B83 Testing & Engineering, an ISO/IEC 17025-accredited lab, supports it.
Key Takeaways
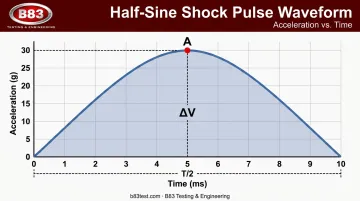
- Half-sine pulses are symmetrical, unipolar waveforms defined by peak acceleration, duration, and ΔV.
- It is one of four classical shock pulses, alongside terminal-peak sawtooth, trapezoidal, and square waveforms.
- Packaging, automotive, and aerospace industries rely on half-sine testing to simulate real-world impacts.
- Accurate results depend on proper instrumentation and analysis, such as the Shock Response Spectrum (SRS).
What Is a Half-Sine Shock Pulse? Definition and Core Characteristics
Mathematically, a half-sine shock pulse is described as:
y(t) = A·sin(ωt), for 0 ≤ t ≤ T/2
Here's what each term means in practical terms:
- A: the peak acceleration, usually measured in g's
- ω: angular frequency, related to how quickly the pulse rises and falls
- T/2: the pulse duration, since only the positive half of a full sine cycle is used
In plain language: the acceleration rises smoothly from zero, hits a peak, then falls back to zero in a mirror-image curve. There are no sharp corners or sudden transitions, which is what separates it from waveforms like the terminal-peak sawtooth.
The ΔV Formula and What It Represents
Three parameters define any half-sine pulse: peak acceleration (g), pulse duration (ms), and velocity change (ΔV). The relationship between them is:
ΔV = (2/π) × A × D × 10⁻³
This formula calculates the total change in velocity the test article experiences during the shock event: the area under the acceleration curve. It matters because ΔV, not peak g alone, often determines whether a mounting bracket or PCB solder joint survives a real impact.
It's Not a Single Frequency
A common misconception is that a half-sine pulse contains one discrete frequency. It doesn't. Fourier analysis shows the pulse actually contains a continuum of spectral content that rolls off at roughly -12 dB per octave as frequency increases, according to research on classical shock pulse waveforms. Most of the energy sits at lower frequencies, which is exactly why half-sine pulses are so effective at exciting mechanical resonances rather than triggering high-frequency electronic failures.
If you're reading a shock test report, check the waveform plot for a smoothly rounded peak, with rise and fall times that mirror each other symmetrically back to baseline.
Types of Shock Pulses: How Half-Sine Compares to Other Classical Waveforms
Half-sine isn't the only classical shock pulse in use. Four shapes dominate industry test specifications, though only two see regular real-world application.
| Pulse Type | Shape | High-Frequency Content | Practical Use |
|---|---|---|---|
| Half-sine | Smooth rise and fall | Lower (-12 dB/octave rolloff) | Mechanical resonance testing |
| Terminal-peak sawtooth | Ramp up, sharp drop | Higher (-6 dB/octave) | Electronics, solder joints, PCBs |
| Trapezoidal | Rise, plateau, fall | Depends on edge speed | Rarely used |
| Square/rectangular | Instant rise and fall | High but hard to achieve | Rarely used |
The terminal-peak sawtooth generates more high-frequency energy than half-sine, making it the preferred choice for testing circuit boards, connectors, and solder joints. Half-sine, by contrast, better represents mechanical structures and larger assemblies responding to lower-frequency energy.
Trapezoidal and square pulses look simple on paper, but they're notoriously difficult to reproduce on physical shaker systems. Sharp-edged transitions demand bandwidth and control precision that most electro-dynamic shakers can't consistently deliver. As a result, half-sine and terminal-peak sawtooth prevail in real-world test specifications, while trapezoidal and square pulses remain the exception.
Real-World Applications of Half-Sine Shock Testing
Half-sine testing spans a surprising range of industries. Here's how it plays out in practice.
Packaging and Transportation Testing
Half-sine pulses simulate the drops, handling shocks, and transit impacts that packages face between the warehouse and the front door. Standards like ISTA test procedures and ASTM D4169 use this kind of testing to identify weak points in packaging design before products ship at scale.
The stakes are real. A 2024 survey found that 60% of Americans received damaged goods from online retailers that year, according to a DS Smith survey conducted by The Harris Poll. For e-commerce and distribution companies, that kind of damage rate translates directly into returns, refunds, and lost customer trust.
Automotive Electronics Reliability
ISO 16750-3 uses half-sine pulses to simulate pothole strikes and collision-related shocks on automotive electronics. Published parameters for rigid-mount components under the 2012 edition specify a 500 m/s² peak (roughly 51 g) for 6 milliseconds, applied across all vehicle directions to represent high-speed curb impacts.
This testing matters most for safety-critical systems (ECUs, airbag controllers, and ABS modules) which must survive these shocks before a vehicle ever reaches production.
Military, Aerospace, and Heavy Equipment
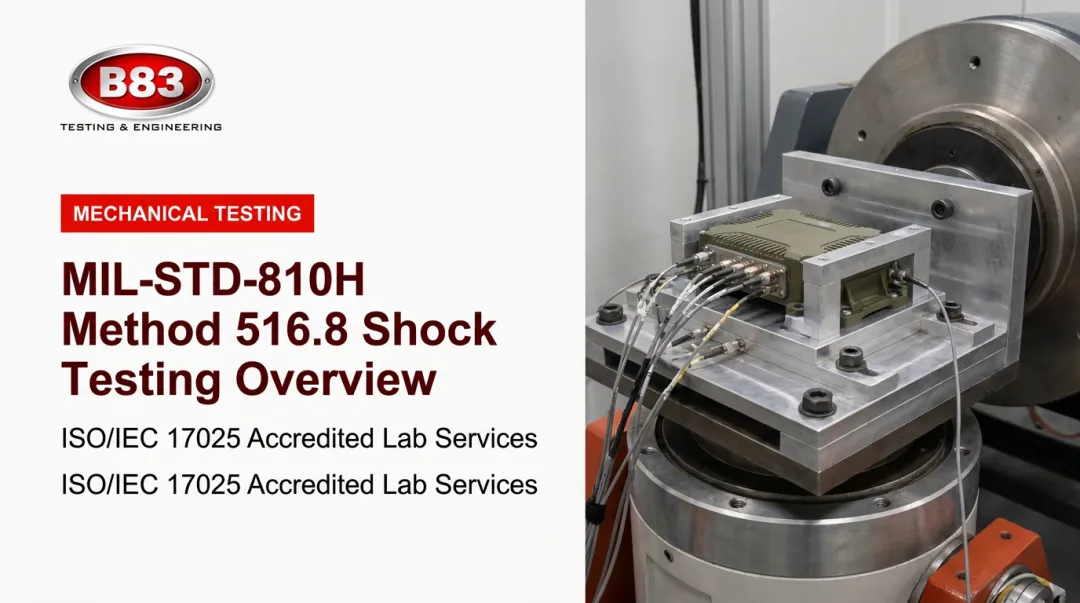
MIL-STD-810H Method 516.8 references half-sine pulses across several tailored procedures, including high-speed craft shock testing at levels ranging from 5 g to 20 g over 23 milliseconds. For heavier equipment or shock-mounted items, an 11 ms half-sine pulse can substitute for a terminal-peak sawtooth when the amplitude is adjusted to produce equivalent velocity change.
Ruggedness testing at this level sits squarely in B83 Testing & Engineering's wheelhouse. The lab serves railroad, agricultural, construction, and aerospace clients who need ruggedness verification for equipment that has to survive years of field abuse, not just a single lab test.
Consumer Electronics and Medical Devices
Half-sine pulses also simulate device drops for phones, tablets, and medical instruments, testing PCB, connector, and housing durability. Test parameters vary widely by product category and mounting configuration, so engineers should confirm specific acceleration and duration targets against the standard relevant to their device (such as IEC 60068-2-27) before designing a test plan.
Measuring and Analyzing Half-Sine Shock Pulses: SRS and Pseudo Velocity Explained
Generating a half-sine pulse is only half the job. Measuring it accurately, and understanding what the data means, is where the real engineering happens.
Key Measurement Parameters and Instrumentation
Engineers measure three parameters on every test: peak acceleration, pulse duration, and ΔV. Capturing them accurately requires:
- Piezoelectric accelerometers mounted at the correct location and orientation
- High-bandwidth data acquisition systems capable of resolving fast transients
- Proper sampling rates, typically well above the pulse's highest meaningful frequency content
Watch for these common sources of measurement uncertainty:
- Fixture resonance adds noise that isn't part of the actual input pulse
- Sensor calibration drift skews readings over time
- Improper filtering distorts the waveform shape entirely
Understanding the Shock Response Spectrum (SRS)
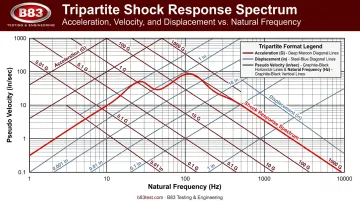
The Shock Response Spectrum models how a family of simple spring-mass systems, each representing a different resonant frequency, would respond to a given shock pulse. Engineers then plot the result as peak acceleration versus natural frequency.
Why does this matter? SRS lets engineers predict how a specific product will respond without physically testing every possible resonance condition.
It's also the standard method for translating a complex, real-world time history into a repeatable, testable lab specification. That translation is a critical step, whether you're designing a test program from scratch or verifying compliance against IEC 60068-2-27's Test Ea.
Understanding Pseudo Velocity
Pseudo velocity is a metric derived from the relative displacement response in an SRS analysis. It's calculated as PV = ωₙ × Z, where Z is the maximum relative displacement and ωₙ is the natural frequency in radians per second.
Unlike raw acceleration, pseudo velocity gives engineers a way to assess shock severity that's less dependent on frequency alone. It's commonly plotted alongside acceleration and displacement in tripartite SRS graphs, and it serves as a severity threshold indicator in both aerospace and seismic engineering applications.
Standards Governing Half-Sine Shock Testing and Choosing a Testing Partner
Several standards define exactly how half-sine testing should be performed and verified:
- IEC 60068-2-27 — specifies waveform tolerances (peak acceleration within 0.8A to 1.2A, duration within 0.9D to 1.1D), and common severity levels like 30 g/18 ms and 50 g/11 ms
- MIL-STD-810H — tailored procedures for defense and aerospace applications
- ISO 16750-3 — automotive-specific shock profiles by mounting location
- ASTM D4169 — distribution-hazard testing frameworks for shipping containers
Each standard sets its own tolerances for pulse shape, duration, and peak levels. Those details matter if your test report ever faces an audit or a liability claim.
Proper compliance documentation should include calibration certificates, waveform verification graphs, and ISO 17025-compliant test reports that confirm the delivered pulse matched the specified pulse.
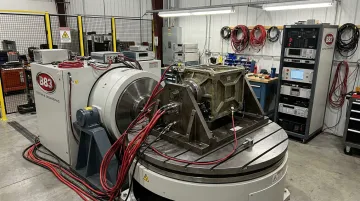
That level of rigor is why B83 Testing & Engineering operates as an ANAB-accredited, engineer-owned independent lab. Our fleet of electro-dynamic shakers generates and verifies half-sine and other classical shock pulses across industries, from automotive components to aerospace hardware.
Scoping a shock test program? Reach out to the B83 team to discuss a plan that documents results able to withstand scrutiny.
Frequently Asked Questions
How do you explain the shock response spectrum?
The Shock Response Spectrum plots peak responses of multiple resonant systems exposed to a shock input, each representing a different natural frequency. Engineers use it to predict how a product design will behave under a given shock event.
What are the different types of shock pulse?
The four classical shock pulses are half-sine, terminal-peak (sawtooth), trapezoidal, and square. Each has different frequency content and is suited to different failure modes, with half-sine and terminal-peak seeing the most real-world use.
What is pseudo velocity?
Pseudo velocity is a metric derived from the maximum relative displacement in an SRS analysis, calculated as the natural frequency multiplied by that displacement. It gauges shock severity in a way less dependent on frequency alone.
What is the difference between a half-sine and a terminal-peak sawtooth pulse?
Terminal-peak sawtooth pulses generate more high-frequency energy, making them better suited to testing electronics and solder joints. Half-sine pulses concentrate energy at lower frequencies, making them ideal for exciting mechanical resonances.
How long does a typical half-sine shock pulse last?
Duration varies enormously by application — military tests can run sub-millisecond, while packaging and consumer electronics tests often span several milliseconds. Always check the specific standard governing your product category for exact duration requirements.
Which industries most commonly require half-sine shock testing?
Packaging and transportation, automotive electronics, aerospace and defense, and consumer electronics are the primary sectors relying on half-sine testing. Each uses it to simulate a different type of real-world drop, impact, or collision event.