Introduction
A satellite separates from its launch vehicle in a burst of pyrotechnic force. A car door slams shut a thousand times during durability testing. A medical device gets dropped on a hospital floor. In every case, engineers need proof the hardware survives — before it ever reaches the field.
That's the job of Shock Response Spectrum (SRS) analysis. It translates a messy, transient shock event into a clear graph engineers can use to write test specifications, catch resonance problems, and make pass/fail calls with confidence.
Getting shock qualification wrong is expensive. NASA's own reports document component failures during ground testing that never occurred across more than 200 Space Shuttle solid rocket booster launches, exposing gaps in traditional shock criteria.
When shock qualification misses the mark, the cost shows up later as warranty claims, field failures, or worse.
This guide closes that gap, breaking down what SRS actually measures, how the calculation works, and how to apply it to real test programs.
TL;DR
- SRS converts a transient shock into peak responses across frequencies, using SDOF (single-degree-of-freedom) theory
- SRS calculates time-domain peak response, unlike FFT's frequency-domain analysis
- Aerospace, defense, automotive, and electronics programs use SRS to predict damage and set test specs
- Damping (Q factor) and SRS type (maxi-max, primary, residual) affect how you read the results
- Accredited labs like B83 Testing & Engineering validate hardware with SRS-based shaker tests
What Is Shock Response Spectrum (SRS) Analysis?
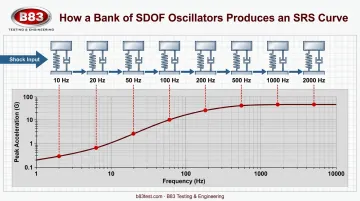
SRS is a graphical and mathematical tool that shows how a range of hypothetical mass-spring-damper systems would respond to a shock input. Each system, or SDOF oscillator, has its own natural frequency. Plot the peak acceleration each oscillator produces against its natural frequency, and you get the SRS curve — the standard language engineers use to describe shock severity.
SRS is not a frequency-domain measurement like an FFT, despite a common assumption otherwise. An FFT decomposes a signal into its frequency components directly. SRS instead calculates the peak time-domain response of dozens of theoretical oscillators, one at a time, then plots those peaks against frequency.
Two signals with identical FFTs can produce different SRS curves, and vice versa.
The concept isn't new. Dr. Maurice Biot first formulated the response-spectrum method in his 1932 Caltech doctoral dissertation, originally developed to characterize earthquake damage potential. The U.S. Navy later adapted the approach in the 1960s to assess mechanical shock severity for shipboard equipment, and it's since become standard practice across aerospace, defense, and industrial testing.
The SDOF Model Behind Every SRS
Picture a single mass attached to a spring and a damper, mounted on a base that gets jolted by the shock input. That's a single-degree-of-freedom (SDOF) system, and its behavior comes down to two properties: natural frequency, how fast the mass wants to oscillate on its own, and damping ratio (or Q factor), how quickly that oscillation dies out.
To build an SRS, engineers don't model just one oscillator. They run a whole bank of them, each tuned to a different natural frequency, logarithmically spaced across the frequency range of interest (commonly at 1/12-octave or 1/3-octave intervals, depending on the standard).
Every filter in that bank "feels" the same shock input but responds differently based on its tuning, and that difference in response is what produces the curve.
Types of SRS Measurements
Not all peak responses are created equal. Standards distinguish between several types:
- Primary positive/negative: the maximum response while the shock excitation is still happening
- Residual positive/negative: the maximum response after the excitation has ended, as the oscillator continues ringing
- Maxi-max: the single largest value across all of the above, positive or negative, primary or residual
Maxi-max is the most commonly reported figure and the one MIL-STD-810H treats as the primary descriptor for pyroshock data.
Damping ratio (Q factor) assumptions vary by application:
- Pyroshock (MIL-STD-810H Method 517.3): Q=10, or 5% critical damping, as the default, with a second pass at Q=50 (1% damping) for lab simulation fidelity checks
- Seismic and earthquake analysis: 5% damping by default, though some governing standards narrow this to 2%
Always check the governing document rather than assuming a value.
Why SRS Analysis Is Critical in Aerospace, Automotive & Industrial Testing
SRS matters because it turns a one-time shock event into a repeatable, comparable specification. Instead of just saying "the part survived this one drop," engineers get a tool that generalizes across scenarios and drives design decisions before hardware ever reaches the field.
Specific benefits include:
- Predicting survival before failure happens: covers drop events, pyrotechnic separations, transportation handling, and seismic loads
- Comparing shock severity apples-to-apples: SRS gives a direct answer on whether a new waveform is more damaging than one already qualified
- Standardizing test specifications: MIL-STD-810, NASA-STD, ISO 18431-4, and ECSS all use SRS as the basis for test criteria, the same specs testing labs like ours build shaker profiles against every week
- Catching resonance amplification: raw peak acceleration alone can hide a frequency band where a component's natural frequency amplifies the shock far beyond the input pulse
- Documenting objective qualification evidence: reduces liability, warranty exposure, and insurance costs if questions arise later
- Guiding design iteration: shifting a component's natural frequency away from a high-response zone can measurably lower its SRS exposure without a full redesign
That last point matters most for design teams: SRS flags problem frequencies early, letting engineers shift a component's natural frequency out of the danger zone before it ever reaches a shaker table.
How SRS Analysis Works – Step by Step
Building a usable SRS takes more than a single calculation. It requires a sequence of deliberate decisions, and skipping validation on sampling rate or damping assumptions is one of the most common (and costly) mistakes engineers make.
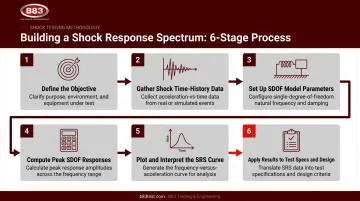
Define the objective. Identify the shock event being characterized (stage separation, transportation drop, seismic load) and define what "survival" means: no permanent damage, or no performance interruption during the event itself. This sets your pass/fail criteria and points you toward the applicable standard.
Gather the shock time-history data. Collect measured acceleration-time data from real events, field recordings, or a standard's defined pulse. Sample rate matters here: it needs to be roughly 10 times the highest frequency you plan to analyze.
Set up the SDOF model parameters. Choose your frequency range, spacing (usually logarithmic, in nth-octave steps), and damping ratio or Q factor appropriate to the event type. Get this wrong and your results won't compare cleanly to prior test data.
Compute the peak SDOF responses. Run the calculation across each frequency point using a recursive filtering method, the Smallwood algorithm, or a prefilter-Smallwood variant, generating maxi-max, primary, and residual values as needed.
Plot and interpret the SRS curve. Convert the peak-response values into a log-log plot and look for frequency bands where the curve spikes well above the raw input. That's where resonance-driven damage risk concentrates.
Apply results to test specs and design decisions. Use the finalized SRS to define a shaker test profile, evaluate design margin, or justify shifting a component's natural frequency out of a high-response zone.
On sampling rate specifically, don't guess. NASA-STD-7003A states plainly that digital sampling should equal or exceed 10 times the highest SRS natural frequency under analysis, and MIL-STD-810H's pyroshock method goes further, requiring at least 1 MHz sample rates for its procedure along with proper anti-alias filtering.
Undersample the data and your SRS will under-predict high-frequency response, exactly the kind of error that surfaces later as a field failure.
SRS Analysis – Example Walkthrough
Here's how this plays out on a straightforward, non-industry-specific example: an electronic enclosure being qualified for a transportation drop event.
Define the objective. Engineers record the acceleration time history from a representative drop test. The goal: no functional failure after the drop, meaning the enclosure and its internal components must remain operational.
Set up the model. The team selects Q=10 (5% critical damping) as a reasonable default and computes the SRS across a frequency band relevant to the enclosure's expected resonances.
Catch the common mistake. Early results look suspiciously mild. The culprit: an inadequate sampling rate on the original data acquisition, which under-predicted the high-frequency peak response. The fix is to resample or reacquire data at least 10 times the maximum analysis frequency, per standard practice.
Interpret the curve. With corrected data, the SRS curve reveals a resonance peak far exceeding the raw pulse amplitude, right where a specific internal bracket is known to resonate. That band gets flagged as high-risk.
Act on the result. Engineers redesign the bracket to shift its natural frequency away from that band. B83's test lab then builds a shaker-reproducible SRS test profile matching the target spectrum, validating the redesigned enclosure against the exact damage identified in the analysis, rather than a generic drop test.
That last step turns analysis into evidence. Qualifying hardware takes a shaker table running a validated profile, not just a curve on a screen.
How B83 Testing & Engineering Can Help
Running the analysis is only half the job. At some point, that SRS specification has to become a real test on real hardware, and that's where B83 Testing & Engineering comes in.
B83 is an ISO/IEC 17025:2017 accredited, engineer-owned independent lab based in Milwaukee, Wisconsin, with Mechanical Shock testing named directly in its ANAB scope of accreditation alongside vibration, acceleration, tensile, and fatigue testing. That accreditation matters because it means the test evidence B83 produces is documented and defensible, not just internally generated data.
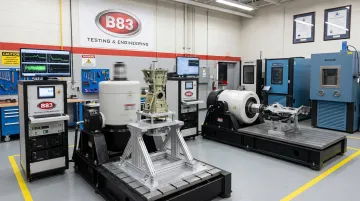
On the equipment side, B83 operates a fleet of five electro-dynamic shakers ranging from 4,000 to 18,000 lbf force capacity. That range covers everything from a small electronic assembly to a larger mechanical subsystem. It also supports SRS test profiles across a wide span of industries B83 already serves, including automotive, aerospace, defense, medical device, and rail.
What working with B83 typically looks like:
- Direct engineering interpretation of SRS requirements pulled from MIL-STD, NASA, ISO, or customer-specific specifications
- Shaker-based waveform synthesis built to reproduce a target SRS, including field data replication (RPC®) for matching real-world shock events
- Accredited, repeatable test evidence that supports liability, warranty, and insurance documentation
- Custom fixture design developed for each test plan, since off-the-shelf mounting rarely fits a specific component
- Flexible scheduling for clients across Wisconsin, Illinois, Michigan, Minnesota, Indiana, Ohio, Iowa, and beyond
If you've got a component that needs to survive a shock event and a specification you need translated into a physical test, reach out to B83's engineering team at (414) 449-9396 or sales@b83test.com. A direct conversation with the people actually running the shakers tends to save time compared to working through layers of account management.
Frequently Asked Questions
What is SRS in shock?
SRS, or Shock Response Spectrum, is a calculated representation of how a range of single-degree-of-freedom systems would respond to a given transient shock. It characterizes the shock's damage potential across a range of frequencies.
What is an SRS test?
An SRS test uses a shaker system to reproduce a target shock response spectrum, rather than a single classical pulse shape. This lets engineers qualify real hardware against a defined SRS specification instead of an arbitrary shock waveform.
What is SRS in electrical terms?
SRS isn't a standard electrical engineering term. The acronym belongs to mechanical and vibration shock testing, so if you encounter it in an electrical context, it likely refers to something unrelated. Check the source document for its specific definition before assuming a connection.
What is the difference between an SRS and a frequency response (FFT)?
An FFT shows the frequency content of a signal directly. An SRS shows the peak time-domain response of hypothetical SDOF oscillators to that signal. The two rarely tell you the same thing.
What damping value (Q) is typically used in SRS analysis?
Q=10 (5% critical damping) is a common default, especially for pyroshock work under MIL-STD-810H. Some seismic and specialized applications use different values, so always verify against the governing standard.
Can an SRS predict fatigue damage?
No. SRS only captures peak response, not cycle count, so it isn't built for fatigue-type damage assessment. A Fatigue Damage Spectrum (FDS) is the appropriate tool when cumulative cyclic damage matters.