Introduction
An engineer opens a vibration test report and sees a jagged line climbing and falling across a frequency axis. No obvious pattern, just peaks and valleys measured in g²/Hz. The question is simple: what does this actually tell you about whether the product survives the field?
That squiggly plot is a Power Spectral Density (PSD) curve, the standard way engineers describe how vibration energy spreads across frequency. Whether you're specifying a test to a lab or reviewing results from one, understanding PSD isn't optional. It's the language of random vibration testing.
This guide breaks down what PSD is, why it matters for product durability, how it's calculated, and how to read the results with confidence.
Key Takeaways
- PSD normalizes vibration data to a 1 Hz bandwidth for direct test comparisons
- Units like g²/Hz measure mean-square acceleration density, not literal power
- Welch's method uses overlapping windowed segments as the industry standard for calculating PSD
- PSD peaks flag resonances or dominant frequencies where fatigue damage concentrates
- Integrating the PSD curve yields the Grms value used to verify test compliance
What is Power Spectral Density (PSD)?
PSD is a statistical measure describing how a signal's power, or more accurately its mean-square amplitude, is distributed across a frequency spectrum. It answers a question that time-domain plots can't: not just how intense the vibration is, but which frequencies are carrying that intensity.
A time-history plot shows acceleration bouncing up and down over seconds or minutes. It tells you peak values and general character, but for random vibration, that average amplitude sits near zero.
It doesn't reveal whether the energy driving those peaks sits at 20 Hz or 2,000 Hz. That distinction matters enormously when a bracket resonates at one frequency and stays quiet at another.
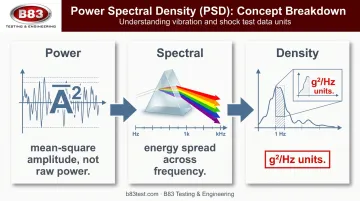
Breaking Down the Name: Power, Spectral, and Density
Each word in "Power Spectral Density" earns its place:
- Power: Since random vibration signals average out to near zero over time, engineers use the mean-square value instead, a stand-in for power that captures signal magnitude without canceling itself out.
- Spectral: PSD is a function of frequency. Think of a prism splitting white light into a rainbow. PSD does the same thing to vibration energy, spreading it across the frequency range so you can see where it concentrates.
- Density: Values are normalized to a 1 Hz bandwidth. This is what makes PSD a density rather than a raw amplitude. That normalization is what lets you compare a signal recorded at 1,000 samples per second against one recorded at 5,000.
For acceleration, the standard units are g²/Hz, sometimes labeled "acceleration spectral density." A related term, Amplitude Spectral Density (ASD), is the square root of PSD and carries different units: g/√Hz. The two terms get confused constantly in vibration standards, so always check which one a data sheet is actually using.
Why Power Spectral Density Matters in Vibration Testing
Real-world vibration, whether from a truck bed, an aircraft fuselage, or a machine chassis, is random and broadband. It doesn't repeat in a clean sine wave. A time-history plot of that environment shows chaos; it can't tell you which frequencies are doing the damage.
PSD solves this by breaking that chaos into frequency bands engineers can actually analyze, and that breakdown pays off in several concrete ways:
Estimating stress and fatigue life. Components fail at their resonant frequencies far faster than at frequencies where they barely respond. By identifying which frequency bands carry the most energy, engineers can correlate PSD data directly to fatigue-critical parts, focusing design attention where it counts.
Comparing against standards or prior test runs. PSD normalizes for bandwidth and duration. That means a calculated PSD from recorded field data can be compared directly against test standards like MIL-STD-810H Method 514.8, which governs random vibration exposure for aircraft, ground vehicles, and marine platforms. It also allows apples-to-apples comparison between test runs recorded months apart.
Root cause identification. When a part fails during testing, a PSD plot helps engineers isolate which frequency range triggered the failure mode, narrowing root cause investigation from "somewhere in the whole spectrum" to a specific band.
The stakes are real. One SAE study on automotive lighting used fatigue-damage equivalence methods to design an 8-hour bench test representing five years or 100,000 km of field use, achieving 99.25% reliability after testing.
That's the value of field-representative random vibration testing done right: it catches what a generic sine sweep would miss.
How is Power Spectral Density Calculated?
The core process converts time-domain data into the frequency domain using a Fast Fourier Transform (FFT), then squares and normalizes the result. In practice, engineers rarely run a single FFT on the whole record. Instead, they use Welch's method, the industry-standard non-parametric technique for PSD estimation.
Welch's Method: Segmenting, Windowing, Averaging
Welch's approach breaks a long data record into shorter, overlapping segments, then processes each one individually:
- Segment the record into overlapping chunks rather than analyzing the entire signal at once
- Apply a window function, commonly a Hanning window, to each segment before transforming it
- Run an FFT on each windowed segment and square the result to get a modified periodogram
- Normalize each result to the frequency bin width, so the output doesn't depend on segment length
- Average all the segment periodograms together to produce a smoother, more statistically reliable PSD estimate
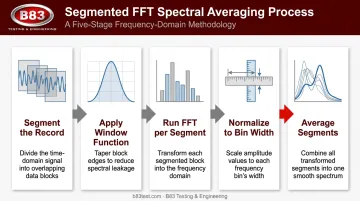
Windowing exists for one reason: preventing spectral leakage. If a data segment doesn't start and end cleanly (which almost none do), that discontinuity spreads energy into neighboring frequency bins, distorting the plot. A window function tapers each segment's edges toward zero, eliminating that artifact.
A couple of practical constraints shape every PSD calculation. Sampling rate must satisfy the Nyquist criterion: it needs to be at least twice the highest frequency of interest, or aliasing corrupts the data.
Frequency bin width matters too. Narrower bins reveal sharper resonant peaks but require longer averaging to stay statistically stable.
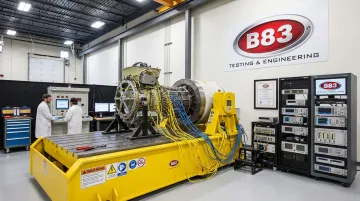
At B83 Testing & Engineering, technicians apply these same constraints when generating PSD profiles from electro-dynamic shaker data, ensuring the resulting spectra accurately represent real-world vibration environments.
How to Interpret PSD Analysis Results
Reading a PSD plot comes down to two questions: where is the energy concentrated, and how much total energy is there?
Peaks indicate frequencies where vibration energy concentrates, often resonances in the test article or dominant frequencies from the excitation source (an engine firing rate, road surface roughness, rotating machinery). Broadband regions, the flatter stretches between peaks, represent distributed random energy without a specific dominant source.
The total energy question gets answered through RMS. Integrating a PSD curve over a frequency range and taking the square root produces the RMS value of the original signal. NASA documentation confirms this relationship directly: RMS values are calculated by integrating PSD over frequency and taking the square root.
For acceleration data, this produces Grms, the number most often compared against a test specification's overall requirement.
Here's the catch: a narrow, tall peak and a broad, low plateau can produce very different-looking PSD curves while contributing similar Grms values. That's why analysts look at both the curve shape and the integrated total, never one without the other.
Bin width plays into this too, creating a resolution-versus-stability tradeoff:
| Bin Width | Resolution | Stability/Noise |
|---|---|---|
| Narrower | Sharper, distinguishes closely spaced resonances | Lower, introduces more statistical noise |
| Wider | Blurred, may merge closely spaced peaks | Higher, smoother and more stable estimate |
Analysts balance this tradeoff based on what they're trying to see in the data.
PSD vs. Related Signal Analysis Concepts
Engineers often confuse PSD with a plain FFT amplitude spectrum, but the two behave differently when acquisition settings change.
| Representation | Shows | Depends On | Best Use |
|---|---|---|---|
| Time history | Amplitude at each moment | Sample rate, record length | Transients, shocks, clipping |
| FFT/amplitude spectrum | Discrete frequency amplitudes | Shifts with bin width | Isolated tones, resonances |
| PSD | Mean-square content per Hz | Normalized to bin width | Broadband random vibration |
A raw FFT amplitude changes if you alter the frequency resolution, since the same energy gets spread across a different number of bins. PSD's normalization to bandwidth removes that dependency, making it the standard for comparing random vibration datasets recorded under different settings.
Beyond this core comparison, two related terms occasionally surface: Amplitude Spectral Density, the square root of PSD, and Allan deviation, used mainly in oscillator stability analysis rather than mechanical vibration. For vibration and shock testing specifically, PSD remains the dominant metric.
Applications of PSD Across Industries
PSD-based random vibration testing shows up wherever products face unpredictable, broadband motion in service:
- Automotive: engine-mounted components and lighting systems tested against field-derived random schedules
- Aerospace and defense: airframe and avionics equipment evaluated against random vibration standards
- Rail: rolling stock and bogie-mounted equipment subjected to spectral vibration profiles
- Medical devices: shipping and transit testing that uses PSD and Grms to define package durability
- Industrial and off-road equipment: broadband random testing that reveals accumulated stress from transport and operation
One of the more advanced applications is field data replication, where engineers capture real-world vibration data from a vehicle or machine in service, then reproduce that same PSD signature on a lab shaker. This closes the gap between simulated test conditions and actual field exposure, giving manufacturers more confidence that a passed lab test predicts real-world durability.
This kind of field-to-lab correlation depends on working with an accredited testing partner. B83 Testing & Engineering, an ISO/IEC 17025 ANAB-accredited, engineer-owned testing laboratory in Milwaukee, has run random vibration and field data replication programs since 2002 for clients across automotive, aerospace, rail, medical device, and industrial sectors.
Because the lab is engineer-owned, engineers make the decisions about test setup, fixture design, and PSD interpretation, not just technicians following a checklist.
Frequently Asked Questions
What is PSD analysis?
PSD analysis is the process of measuring and calculating how a signal's power is distributed over frequency, typically using FFT-based methods like Welch's method. It's used to characterize random vibration or noise in a way that's independent of measurement settings.
How do you interpret PSD analysis results?
Peaks indicate concentrated vibration energy at specific frequencies, often resonances, while broadband regions show distributed random energy. The overall RMS derived from integrating the PSD curve gets compared against test specifications.
What are the units of power spectral density?
Units depend on the measured quantity per Hz. Acceleration PSD uses g²/Hz; voltage PSD uses V²/Hz. The squared units reflect the mean-square nature of the density calculation.
What's the difference between PSD and FFT?
An FFT converts time data into frequency data, but its magnitude depends on sample rate and record duration. PSD normalizes those factors to a 1 Hz bandwidth, allowing consistent comparisons across different acquisition settings.
Why is PSD used instead of a simple amplitude spectrum in vibration testing?
Random, broadband vibration doesn't have discrete, repeatable amplitudes the way a pure tone does. PSD's normalization to bandwidth makes it the appropriate metric for characterizing that kind of energy distribution consistently.
What industries commonly require PSD-based vibration testing?
Automotive, aerospace, rail, medical device, and industrial or consumer product manufacturers all use PSD-based random vibration testing to validate durability under real-world, unpredictable motion.